

Image Details
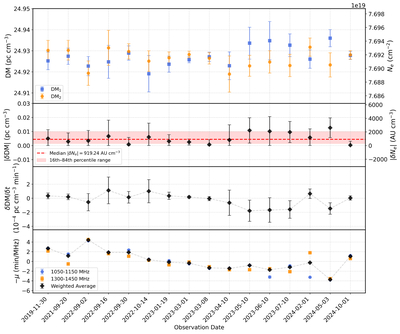
Caption: Figure 2.
DM and scintillation drift variations of M53A. From top to bottom: DM measurements from the two observation halves; their absolute differences, with the median and 16th–84th percentile range shown by the red dashed line and shading; intraobservation DM variation rates; and the negative drift rate −μ referenced to 1.5 GHz for the two sub-bands and their weighted averages. Right-hand axes show the corresponding electron-column quantities.
Other Images in This Article
Copyright and Terms & Conditions
© 2026. The Author(s). Published by the American Astronomical Society.

Copyright ©
2026 Astronomy Image Explorer. All Rights Reserved.
