

Image Details
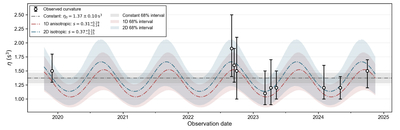
Caption: Figure 1.
Scintillation-arc curvature of M53A referenced to 1.5 GHz. Black points show the measurements, while the gray, red, and blue curves and shaded 68% intervals represent the constant baseline, 1D anisotropic model, and 2D isotropic model, respectively.
Other Images in This Article
Copyright and Terms & Conditions
© 2026. The Author(s). Published by the American Astronomical Society.

Copyright ©
2026 Astronomy Image Explorer. All Rights Reserved.
