

Image Details
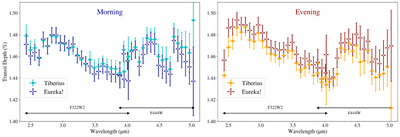
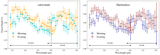
Caption: Figure A2.
The morning (left) and evening (right) transmission spectra obtained for each of our reduction pipelines (detailed in Sections 2.1.1 and 2.1.2). The light curves were fit with Harmonica (see Section 3.1). The transit depths obtained from the Tiberius reduction are shown as filled squares, whereas the transit depths obtained from the Eureka! reduction are shown as unfilled diamonds. Horizontal black arrows highlight the wavelength coverage of the NIRCam F322W2 and F444W filters. No offset has been applied to the F444W values.
Other Images in This Article
Copyright and Terms & Conditions
© 2026. The Author(s). Published by the American Astronomical Society.

Copyright ©
2026 Astronomy Image Explorer. All Rights Reserved.
