

Image Details
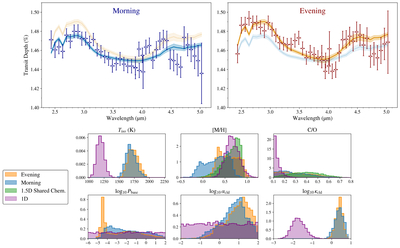
Caption: Figure 4.
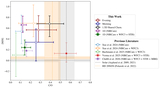
Results of the fiducial 1.5D Exo Skryer equilibrium chemistry retrieval (see Section 4.1.2) applied to the Harmonica transmission spectra. The top panels display the median model transmission spectra and 1σ confidence intervals derived from 10,000 posterior samples, with the morning and evening spectra shown on the left and right, respectively. For reference, the evening and morning median models are also shown with a lower opacity on the left and right, respectively. The bottom panels present the marginal posterior distributions for the corresponding limb parameters, with the morning and evening posteriors highlighted in blue and orange, respectively. For comparison, the marginal posteriors from our 1D NIRCam-only atmospheric retrieval are plotted in purple. Similarly for the [M/H] and C/O posteriors, the marginal posteriors from a 1.5D atmospheric retrieval assuming shared chemistry between the limbs are plotted in green.
Other Images in This Article
Copyright and Terms & Conditions
© 2026. The Author(s). Published by the American Astronomical Society.

