

Image Details
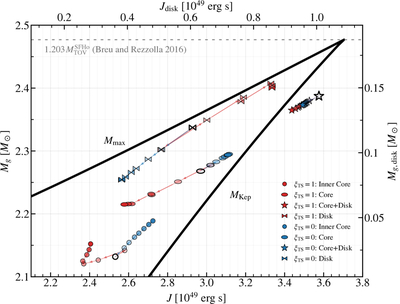
Caption: Figure 6.
Evolution of gravitational mass, Mg, and AM for the remnant core, disk, and total core–disk system (as indicated by the different markers). Note that the disk mass, Mdisk, axis is shown separately on the right. The inner core, core, and disk are defined by ρ > 1014, >1013 and <1013 g cm−3, respectively, and are represented by circle, ellipse, and bow-tie markers; stars denote the total core–disk quantities. Disk quantities are shown on the upper and right axes. Hollow markers indicate the initial state at ﹩\bar{t}=15\,{\rm{ms}}﹩, while filled markers show subsequent snapshots separated by approximately 50 ms and connected by thin lines. Darker shades correspond to later times, and colors distinguish the models. The lower and upper solid black curves denote the mass-shedding limit, MKep(J), and the maximum mass supported against gravitational collapse, ﹩{M}_{{\rm{\max }}}(J)﹩, respectively, estimated using B. Margalit et al. (2022), C. Breu & L. Rezzolla (2016), and E. R. Most et al. (2020). The gray dashed line marks the maximum mass supported by uniform rotation at the Keplerian limit, ﹩{M}_{{\rm{\max }}}({J}_{{\rm{Kep}}})=1.203\,{M}_{{\rm{TOV}}}^{{\rm{SFHo}}}﹩, where ﹩{M}_{{\rm{TOV}}}^{{\rm{SFHo}}}=2.06\,{M}_{\odot }﹩ (C. Breu & L. Rezzolla 2016). The initial gravitational masses represented by the hollow markers are 2.13, 2.27, 0.12, and 2.39 M⊙ for the inner core, core, disk, and total system, respectively.
Other Images in This Article
Show More
Copyright and Terms & Conditions
© 2026. The Author(s). Published by the American Astronomical Society.

