

Image Details
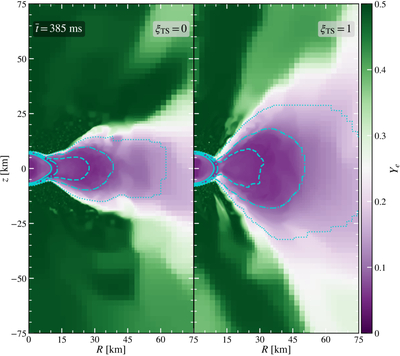
Caption: Figure 10.
Electron-fraction profiles at ﹩\bar{t}=385\,{\rm{ms}}﹩ for the ξTS = 0 (left) and ξTS = 1 (right) models. Cyan contours denote rest-mass density as defined in Figure 7.
Other Images in This Article
Show More
Copyright and Terms & Conditions
© 2026. The Author(s). Published by the American Astronomical Society.

Copyright ©
2026 Astronomy Image Explorer. All Rights Reserved.
