

Image Details
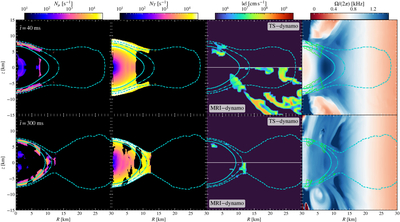
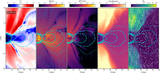
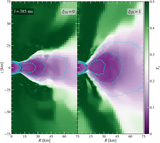
Caption: Figure 1.
From left to right: meridional slices of the fiducial (ξTS = 1) model of the composition (Nμ) and thermal (NT) contributions to the Brunt–Väisälä frequency, the absolute value of the isotropic α-effect coefficient, ∣κ∣, and the rotational frequency, Ω/(2π). The snapshots are shown at ﹩\bar{t}=40\,{\rm{ms}}﹩ (top row) during the TS-dynamo growth stage and ﹩\bar{t}=300\,{\rm{ms}}﹩ (bottom row). In the ∣κ∣ panels, the upper half-plane shows the contribution from the TS dynamo, while the lower half-plane shows that from the MRI dynamo. Dashed, dashed–dotted, and solid cyan curves denote rest-mass density contours of 1012, 1013, and 1014 g cm−3, respectively. Green contours mark regions where ﹩| {\rm{\Omega }}| ={{\rm{\Omega }}}_{\mathrm{TS}}\equiv \sqrt{{\omega }_{{\rm{A}},\mathrm{sat}}{N}_{\mathrm{BV}}}﹩, where the saturated-state TI growth timescale equals the AM-transport timescale estimated from Equation (35) of J. Fuller et al. (2019). The regions enclosed by the green contours correspond to ∣Ω∣ < ΩTS.
Other Images in This Article
Show More
Copyright and Terms & Conditions
© 2026. The Author(s). Published by the American Astronomical Society.

