

Image Details
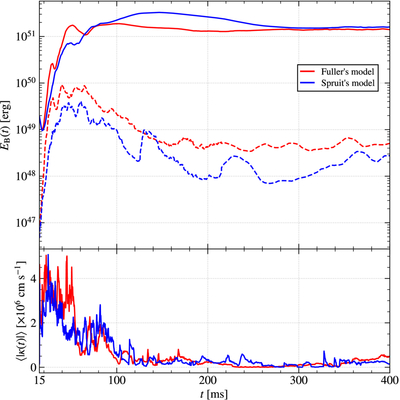
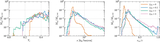
Caption: Figure C3.
Same as Figure 2, but comparing H. C. Spruit (2002)’s model (blue lines) and J. Fuller et al. (2019)’s model (red lines) used in main text. We assume ξTS = 1 and χTS = 1 in both cases.
Other Images in This Article
Show More
Copyright and Terms & Conditions
© 2026. The Author(s). Published by the American Astronomical Society.

Copyright ©
2026 Astronomy Image Explorer. All Rights Reserved.
