

Image Details
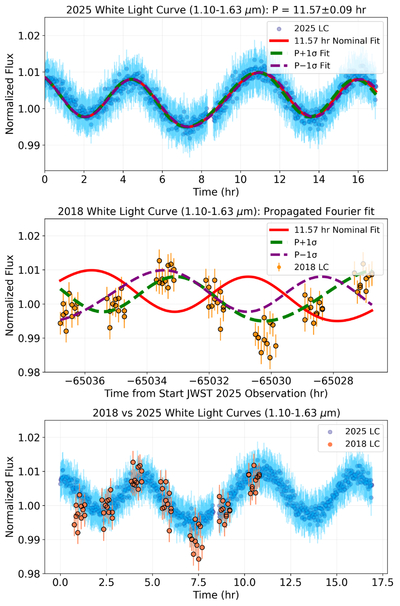
Caption: Figure 4.
Top panel: 2025 white light curve covering the same wavelength range as the HST/WFC3 white light curve obtained in 2018 with its best Fourier function fit (P = 11.57 ± 0.09 hr, red line). The same fits using the derived period plus its 1σ uncertainty (green) and the derived period minus its 1σ uncertainty (purple). Middle panel: 2018 HST/WFC3 white light curve with the best Fourier fits calculated using the JWST/NIRSpec white light curve (1.10–1.63 μm) propagated to the epoch of the HST/WFC3 light curve. Bottom panel: cross-correlated 2018 HST/WFC3 and 2025 JWST/NIRSpec 1.10–1.63 μm light curves overplotted.
Other Images in This Article
Copyright and Terms & Conditions
© 2026. The Author(s). Published by the American Astronomical Society.

