

Image Details
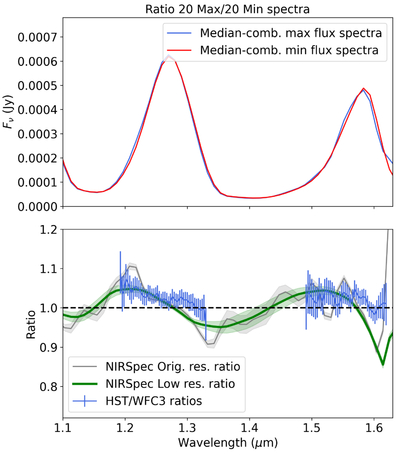
Caption: Figure 3.
Top panel: median combination of the 20 maximum flux (blue) and 20 minimum flux spectra (red). Bottom panel: spectral ratio of the JWST/NIRSpec spectra between 1.1 and 1.62 μm before smoothing (gray line) and after smoothing (green line). We also show the ratios obtained by E. Manjavacas et al. (2019) using HST/WFC3 spectra (blue).
Other Images in This Article
Copyright and Terms & Conditions
© 2026. The Author(s). Published by the American Astronomical Society.

Copyright ©
2026 Astronomy Image Explorer. All Rights Reserved.
