

Image Details
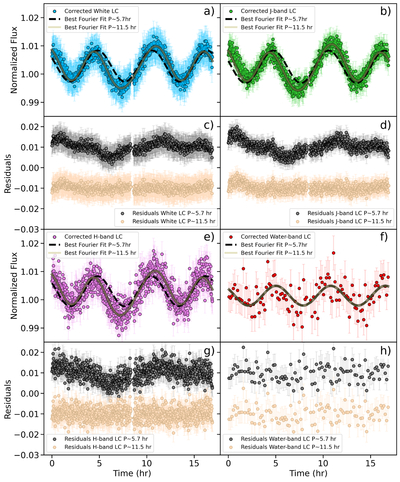
Caption: Figure 1.
White light curve (1.10–1.63 μm, blue, panel (a)), J- (green, panel (b)), H- (pink, panel (e)), and water-band (red, panel (f)) light curves, with their respective best-fit models after being corrected by systematics (panels (c), (d), (g), and (h)). The best Fourier fit with P ∼ 5.7 hr (dashed black line) and with P ∼ 11.5 hr (solid gray line). We also include in a panel below each light curve their respective residuals after subtracting their best-fit model using a period initial guess of Pinitialguess = 5.7 hr (gray) and in light brown/peach color after subtracting their best-fitting model with Pinitialguess = 11.5 hr.
(The data used to create this figure are available in the online article.)
(The data used to create this figure are available.)
Other Images in This Article
Copyright and Terms & Conditions
© 2026. The Author(s). Published by the American Astronomical Society.

