

Image Details
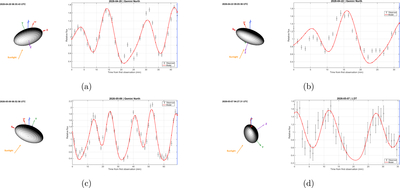
Caption: Figure A1.
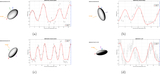
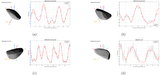
Animations showing the LAM rotational model and the fit to lightcurves from April 20 (a), April 22 (b), May 9 (c), and May 7 (d), respectively. The angles between the line of sight and the angular momentum vector L are 100∘, 99∘, 88∘, and 89∘ in the four epochs, respectively. Therefore, the angular momentum is almost within the image plane. Animations of all panels are available online. The observational time intervals shown in the animation are 2026 April 20 08:13:09–08:55:43 UTC for panel (a), 2026 April 22 08:34:20–09:05:56 UTC for panel (b), 2026 May 9 07:44:13–08:52:56 UTC for panel (c), and 2026 May 7 03:32:58–04:27:31 UTC for panel (d). The real-time duration of the animation is 24 s.
(An animation of this figure is available in the online article.)
(An animation of this figure is available.)
The video/animation of this figure is available in the online journal.
Other Images in This Article
Copyright and Terms & Conditions
© 2026. The Author(s). Published by the American Astronomical Society.

