

Image Details
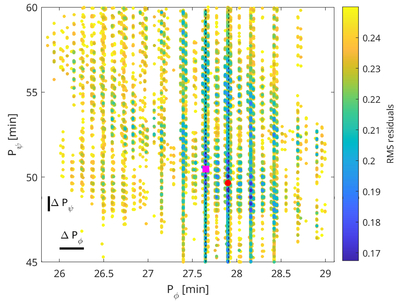
Caption: Figure 4.
Period scan for ellipsoidal shape. The colorbar marks the model RMS. For clarity, points with RMS values above 0.25 are not plotted. The best-fit value with the lowest RMS is marked with a red point and corresponds to the values in Table 2. The pink square marks the second best solution. The two dashed vertical lines mark the two best periods found by the period analysis described in Section 3. The thick horizontal and vertical lines show the separations ΔPψ and ΔPϕ between local minima (see the main text).
Other Images in This Article
Copyright and Terms & Conditions
© 2026. The Author(s). Published by the American Astronomical Society.

Copyright ©
2026 Astronomy Image Explorer. All Rights Reserved.
