

Image Details
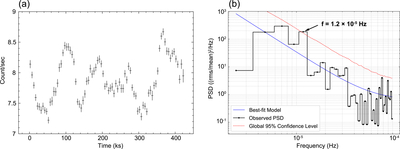
Caption: Figure A1.
(a) XRISM Xtend light curve in the 0.5–10 keV band, showing the temporal evolution of the X-ray flux. (b) Power spectral density (PSD) derived from the light curve, exhibiting a significant peak at approximately 1.2 × 10⁻⁵ Hz. The solid blue line represents the best-fit model (red noise plus Poisson noise), and the dashed red line indicates the global 95% confidence level. The detection of the peak above this threshold confirms its statistical significance against the underlying red-noise continuum.
Other Images in This Article
Copyright and Terms & Conditions
© 2026. The Author(s). Published by the American Astronomical Society.

Copyright ©
2026 Astronomy Image Explorer. All Rights Reserved.
