

Image Details
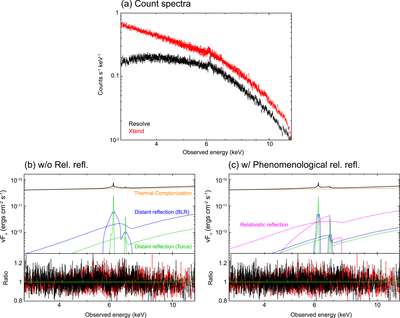
Caption: Figure 2.
(a) XRISM/Resolve (black) and Xtend (red) spectra of 3C 120 in count space. (b) The top panel shows the best-fit model using a baseline model excluding any relativistic reflection component, and the bottom panel shows the data-to-model ratios. (c) Same as panel (b), but including a phenomenological relativistically blurred reflection component. In panels (b) and (c), the total model (black solid line) comprises the primary thermal Comptonization continuum (orange), the relativistically blurred reflection (magenta), and neutral Fe Kα emission lines (intermediate width in blue; narrow in green) originating from distant reflectors. The Galactic photoelectric absorption effect is incorporated in the spectral modeling.
Other Images in This Article
Copyright and Terms & Conditions
© 2026. The Author(s). Published by the American Astronomical Society.

