

Image Details
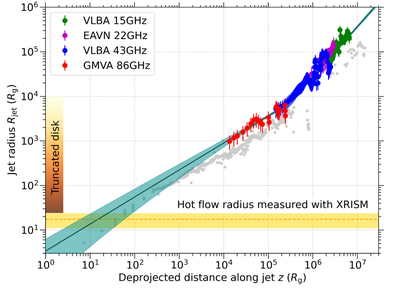
Caption: Figure 5.
Jet radius of 3C 120 as a function of deprojected distance from the radio core at 86 GHz, both expressed in units of the gravitational radius. The red, blue, magenta, and green data points correspond to measurements from the GMVA 86 GHz, VLBA 43 GHz, EAVN 22 GHz, and VLBA 15 GHz images, respectively. The black solid line shows the best-fit broken power-law jet profile (Rjet(z) ∝ z0.61 ± 0.07 for z < z0 and Rjet(z) ∝ z1.13 ± 0.04 for z > z0 where z0 = (3.13 ± 0.77) × 105Rg) with the cyan-shaded region representing 1σ uncertainty range of the fit. The horizontal gold-shaded band denotes the radius of the hot accretion flow (﹩{R}_{\mathrm{in}}=17.{4}_{-6.5}^{+6.3}{R}_{g}﹩) inferred from the XRISM spectral analysis (Figure 3). For reference, the jet profile of M87 (K. Asada & M. Nakamura 2012; K. Hada et al. 2024) is overlaid as gray data points. All quoted uncertainties represent the 1σ confidence level.
Other Images in This Article
Copyright and Terms & Conditions
© 2026. The Author(s). Published by the American Astronomical Society.

