

Image Details
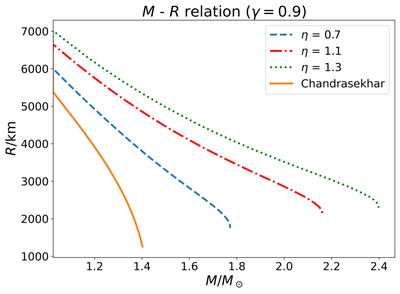
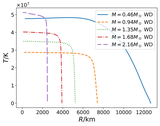
Caption: Figure 2.
M–R curves showing different mass limits for different magnetic field profiles, i.e., different η (η and γ describe the magnetic field profile defined in Appendix A). ﹩\dot{M}=1{0}^{-9}\,{M}_{\odot }\,{{\rm{yr}}}^{-1}﹩ began at 1.02 M⊙ for all cases.
Other Images in This Article
Copyright and Terms & Conditions
© 2026. The Author(s). Published by the American Astronomical Society.

Copyright ©
2026 Astronomy Image Explorer. All Rights Reserved.
