

Image Details
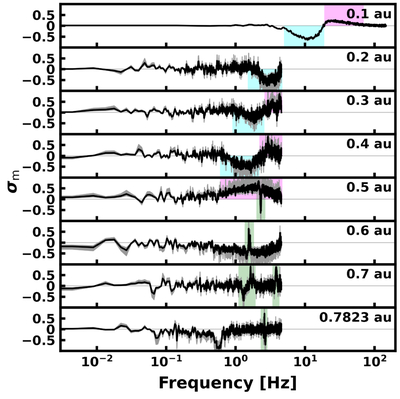
Caption: Figure 3.
Normalized magnetic helicity density spectra σm in the spacecraft frame. The spectra are computed via Welch’s method (segment length 213), with gray shaded regions indicating 95% confidence intervals. Red and blue areas represent positive and negative helicity, respectively, while green areas denote suspected instrumental artifacts. Note that individual intervals may capture periods of transiently low wave amplitude due to the inherent intermittency of solar wind turbulence (R. Bruno & V. Carbone 2013; V. K. Jagarlamudi et al. 2021; C. Froment et al. 2023). The comprehensive evolution of these modes across the inner heliosphere is further detailed in Figure 4.
Other Images in This Article
Copyright and Terms & Conditions
© 2026. The Author(s). Published by the American Astronomical Society.

