

Image Details
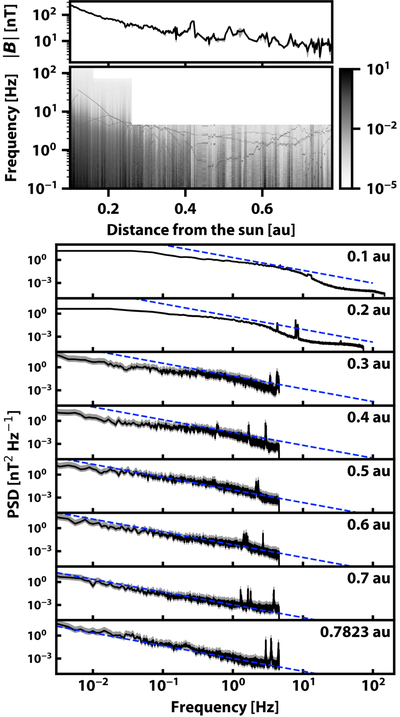
Caption: Figure 2.
Radial evolution of magnetic field intensity and power spectral density. (Top) Magnetic field magnitude ∣B∣ as a function of heliocentric distance. The gray shaded region represents the standard deviation calculated over the 1 hr intervals. (Middle) PSD of magnetic field fluctuations shown as a color map in the frequency–distance plane. The spectra are computed via Welch’s method with a segment length of 213 points. (Bottom) Representative 1D spectra at seven heliocentric distances, extracted from the middle panel. Blue dashed lines denote a −5/3 spectral index for reference. Deviations from this scaling are visible as the spacecraft approaches the Sun.
Other Images in This Article
Copyright and Terms & Conditions
© 2026. The Author(s). Published by the American Astronomical Society.

