

Image Details
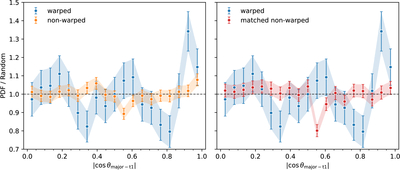
Caption: Figure 1.
Distribution of ﹩| \cos \theta | ﹩ between the galaxy major axis and the tidal field t1 direction for warped galaxies (blue), nonwarped galaxies (orange), and a matched nonwarp control sample (red). The curves show probability density functions (PDFs) computed from the data and normalized to a uniform distribution. The shaded regions represent 1σ uncertainties estimated via bootstrap resampling (Nboot = 2000). The dashed horizontal line shows the uniform distribution expectation. The left panel compares warped galaxies to the full nonwarped sample, and the right panel compares warped galaxies to the matched control sample.
Other Images in This Article
Copyright and Terms & Conditions
© 2026. The Author(s). Published by the American Astronomical Society.

