

Image Details
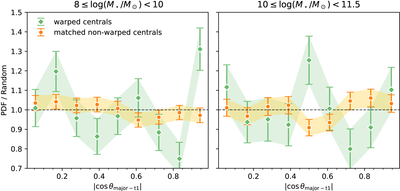
Caption: Figure 3.
Distribution of ﹩| \cos \theta | ﹩ between the galaxy major axis and the tidal field t1 direction for central galaxies in two stellar mass bins, using warped galaxies and a matched nonwarped control sample. The left and right panels correspond to ﹩8\leqslant \mathrm{log}({M}_{\star }/{M}_{\odot })\lt 10﹩ and ﹩10\leqslant \mathrm{log}({M}_{\star }/{M}_{\odot })\lt 11.5﹩, respectively. The curves show probability density functions (PDFs) computed from the data normalized relative to a uniform distribution. The shaded regions represent 1σ uncertainties estimated via bootstrap resampling (Nboot = 2000).
Other Images in This Article
Copyright and Terms & Conditions
© 2026. The Author(s). Published by the American Astronomical Society.

Copyright ©
2026 Astronomy Image Explorer. All Rights Reserved.
