

Image Details
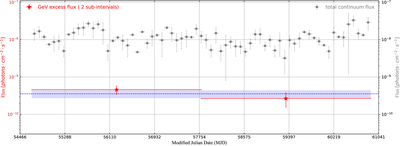
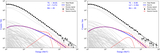
Caption: Figure A3.
Temporal stability of the spectral excess for 4FGL J0136.5+3906. The 17 yr period (2008.8–2025.8) is split into two equal subperiods in the 100 MeV to 1 TeV range. Red stars (left y-axis): flux of the spectral excess in each subperiod. Blue dotted line and shaded area: best-fit constant value and its 1σ uncertainty from fitting a constant to the two red points. Gray (dots) curve (right y-axis): total gamma-ray flux above 100 MeV.
Other Images in This Article
Copyright and Terms & Conditions
© 2026. The Author(s). Published by the American Astronomical Society.

Copyright ©
2026 Astronomy Image Explorer. All Rights Reserved.
