

Image Details
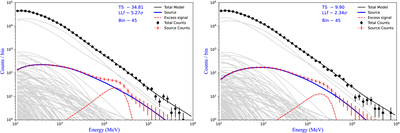
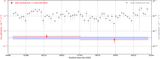
Caption: Figure A2.
Model-fitted count spectra of 4FGL J0136.5+3906 over a first 8.5 yr (left, 2008.8-2017.2) and a second 8.5 yr (right, 2017.2-2025.8) subset with 45 logarithmically spaced energy bins. Black dots and black line: data and total model; light gray lines: background sources; red dotted–dashed line: source model; blue solid line: log-parabola continuum; red dashed line: Gaussian excess. The corresponding spectral-fit parameters are listed in Table A1.
Other Images in This Article
Copyright and Terms & Conditions
© 2026. The Author(s). Published by the American Astronomical Society.

Copyright ©
2026 Astronomy Image Explorer. All Rights Reserved.
