

Image Details
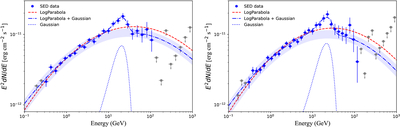
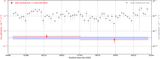
Caption: Figure 1.
Spectral energy distribution (SED) and spectral excess signal of 4FGL J0136.5+3906 in the 100 MeV to 1 TeV range, using 17 yr of data (left panel: 35 bins, right panel: 45 bins). The SED is fitted with a pure log-parabola model (null hypothesis, red dashed line) and with a log-parabola plus Gaussian model (signal hypothesis, blue dotted–dashed line). Blue points denote SED bins with TS > 25; gray downward arrows indicate upper limits. The blue dotted line represents the Gaussian excess component.
Other Images in This Article
Copyright and Terms & Conditions
© 2026. The Author(s). Published by the American Astronomical Society.

Copyright ©
2026 Astronomy Image Explorer. All Rights Reserved.
