

Image Details
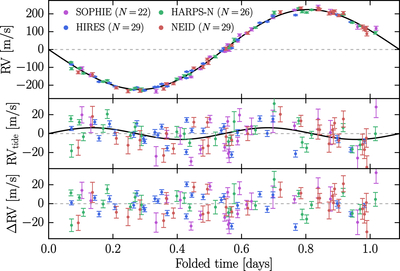
Caption: Figure 2.
First panel: WASP-12’s RV dataset, folded with respect to the period of WASP-12 b (transits occur at t = 0). The best-fitting “WASP-12 b + tidal bulge” model is plotted in black. Second panel: tidal RV signal, obtained by subtracting the RV model with Ktide = 0. The 6 m s−1 modulation due to the star’s tidal bulge is detected, illustrating the sensitivity of the dataset to low-amplitude signals. Third panel: RV residuals. All error bars show formal uncertainties, before inflation with jitter terms (Table 1). The residuals appear randomly distributed around zero, with underestimated uncertainties but no obvious trends.
Other Images in This Article
Copyright and Terms & Conditions
© 2026. The Author(s). Published by the American Astronomical Society.

