

Image Details
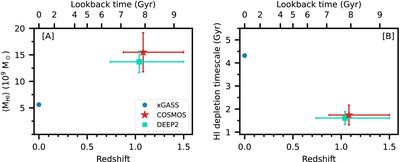
Caption: Figure 5.
The plot shows a comparison between (A) the average H I mass, and (B) the characteristic H I depletion timescale, for stellar-mass-matched samples of star-forming galaxies in COSMOS (red star; this work), blue star-forming galaxies in the DEEP2 survey fields (green squares; A. Chowdhury et al. 2022a), and blue star-forming galaxies from the xGASS survey (blue circles; B. Catinella et al. 2018). It is clear that both the average H I mass and the characteristic H I depletion timescale are in excellent agreement for the COSMOS and DEEP2 galaxies at z ≈ 1, and that both are very different from the corresponding values for the xGASS galaxies at z ≈ 0.
Other Images in This Article
Copyright and Terms & Conditions
© 2026. The Author(s). Published by the American Astronomical Society.

