

Image Details
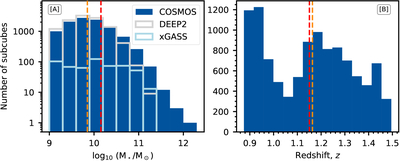
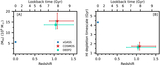
Caption: Figure 2.
The distributions of [A] the logarithm of the stellar mass, and [B] the redshift of the 10,722 independent subcubes (from 8122 unique galaxies) that were used in the final H I 21 cm stacking analysis. The dashed orange and red lines indicate the median and the mean values of each distribution, respectively. For comparison, we have also plotted in panel [A] the stellar-mass distributions of the DEEP2 galaxies of the GMRT CATz1 survey (gray open histogram; A. Chowdhury et al. 2022a) and the xGASS survey (light blue open histogram; B. Catinella et al. 2018).
Other Images in This Article
Copyright and Terms & Conditions
© 2026. The Author(s). Published by the American Astronomical Society.

Copyright ©
2026 Astronomy Image Explorer. All Rights Reserved.
