

Image Details
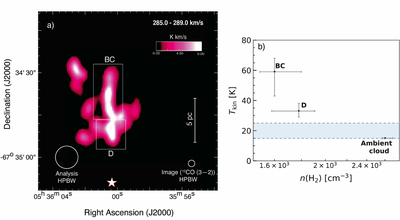
Caption: Figure 3.
(a) Intensity map of jet clouds in velocity range 285−289 km s−1. The boxes indicate the pixel regions selected for estimating physical properties. (b) Kinetic temperature of jet clouds BC and D along with the ambient cloud estimated in this study are plotted against their density. The horizontal dotted lines indicate the typical temperature range of unshocked cloud in LMC including the uncertainties.
Other Images in This Article
Copyright and Terms & Conditions
© 2026. The Author(s). Published by the American Astronomical Society.

Copyright ©
2026 Astronomy Image Explorer. All Rights Reserved.
