

Image Details
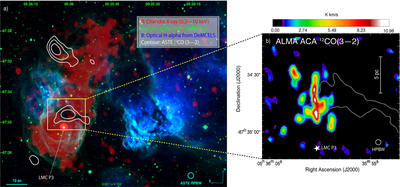
Caption: Figure 1.
(a) Multiwavelength overview of the SNR DEM L241 region. Red shows Chandra X-ray emission in 0.3−10 keV, green shows [S II] optical emission from DeMCELS, and blue shows Hα emission from DeMCELS. Overlaid contours represent ASTE 12CO(J=3–2) emission. The yellow box indicates the ALMA ACA observation mosaic region. (b) ALMA 12CO(J=3–2) emission integrated over the velocity range 285.6−288.0 km s−1 that shows jet clouds. The contour shows the ALMA 12CO(J=3–2) emission integrated over the velocity range 279.6–283.6 km s−1, representing the ambient molecular cloud, at a significance level of 3σ. The position of the point source is marked with a star symbol.
Other Images in This Article
Copyright and Terms & Conditions
© 2026. The Author(s). Published by the American Astronomical Society.

