

Image Details
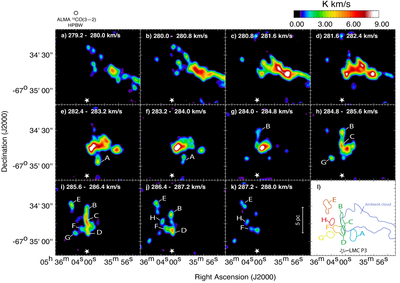
Caption: Figure 2.
Panels (a)−(k) present the velocity channel maps from the ALMA 12CO (J=3–2) observations, with a velocity interval of 0.8 km s−1. Panel (l) shows the spatial distribution of all identified clouds, displayed as contours in different colors.
Other Images in This Article
Copyright and Terms & Conditions
© 2026. The Author(s). Published by the American Astronomical Society.

Copyright ©
2026 Astronomy Image Explorer. All Rights Reserved.
