

Image Details
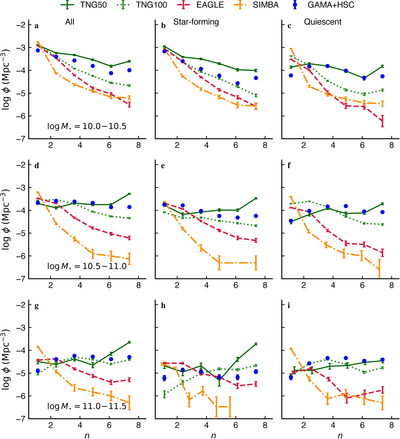
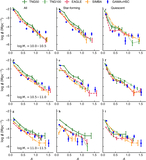
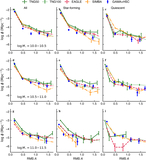
Caption: Figure 1.
Sérsic index function. Number densities of galaxies as a function of i-band Sérsic index, n, are shown in panels for three stellar mass bins (﹩{\rm{log}}({M}_{\star }/{M}_{\odot })=10.0﹩–10.5, 10.5–11.0, 11.0–11.5) and three star formation categories (all galaxies, star-forming: ﹩{\rm{\Delta }}\mathrm{log}{\rm{SFR}}\gt -1﹩, quiescent: ﹩{\rm{\Delta }}\mathrm{log}{\rm{SFR}}\lt -1﹩). Each panel displays the logarithmic number density, ﹩{\rm{log}}(\phi (n)/{{\rm{Mpc}}}^{-3})﹩, versus Sérsic index. Simulations are indicated by colored lines: TNG50 (dark green, solid), TNG100 (forest green, dotted), EAGLE (crimson, dashed), and SIMBA (dark orange, dashed–dotted). Observational data from HSC+GAMA are shown as blue circles.
Other Images in This Article
Show More
Copyright and Terms & Conditions
© 2026. The Author(s). Published by the American Astronomical Society.

