

Image Details
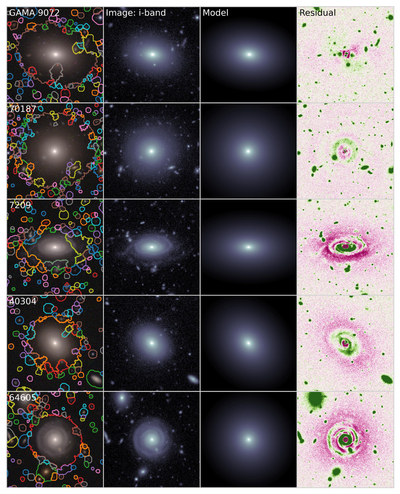
Caption: Figure A1.
Examples of bright HSC galaxies and their structural modeling. Columns left to right: (a) HSC gri color composites, including masks for foreground and background sources. (b) HSC i-band images used for the structural analysis. (c) Best-fitting i-band ProFit models. (d) Residual images obtained by subtracting the models from the data. Residual color scales span −5 to +5 times the average sky noise, where purple indicates oversubtracted regions and green indicates undersubtracted regions. For visualization purposes, the displayed images are zoomed by a factor of 3 relative to those used for source detection and deblending, enhancing the visibility of the galaxy light distribution and residual structures.
Other Images in This Article
Show More
Copyright and Terms & Conditions
© 2026. The Author(s). Published by the American Astronomical Society.

