

Image Details
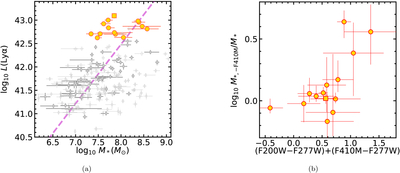
Caption: Figure 4.
(a) L(Lyα) as a function of M*. Our sample is indicated by the same markers, and the filled and open gray diamonds represent the less luminous samples of LAEs at z > 4.5 and z ≤ 4.5 from I24, respectively. The dashed line is the best-fit linear function to the z > 4.5 subsample. (b) Comparing the stellar masses derived from the SED fitting with the inclusion (M*) and exclusion (M*,-F410M) of F410M; the horizontal axis represents the sum of two colors, F200W − F277W and F410M − F277W.
Other Images in This Article
Copyright and Terms & Conditions
© 2026. The Author(s). Published by the American Astronomical Society.

Copyright ©
2026 Astronomy Image Explorer. All Rights Reserved.
