

Image Details
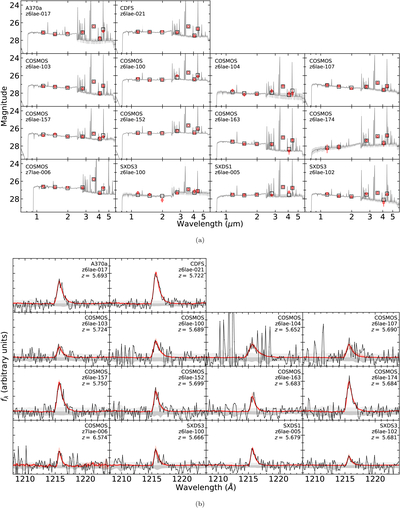
Caption: Figure 2.
(a) SED fitting in the (rest-frame) UV to optical bands for the LAEs in our sample. In each panel for each LAE, the gray line represents the best-fit SED model with the light gray region representing 1σ uncertainty. The red circles and black squares are the photometric data points from JWST/NIRCam imaging observations and computations of the best-fit model, respectively. (b) Lyα lines in the Magellan/M2FS spectra of LAEs in our sample. Flux density fλ is shown in arbitrary units. The (slightly different) gray-shaded regions indicate ±1σ uncertainty level. The red lines are the best-fit Lyα profiles based on the line templates while the light shaded region represent the 16th–84th percentiles (1σ) of the posterior.
Other Images in This Article
Copyright and Terms & Conditions
© 2026. The Author(s). Published by the American Astronomical Society.

