

Image Details
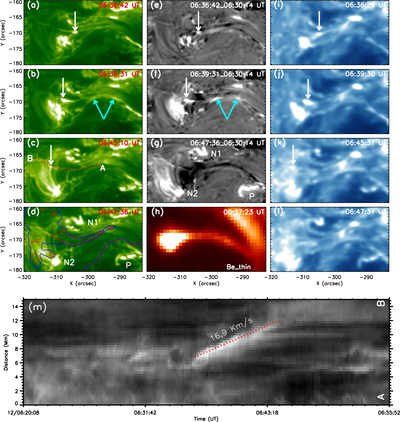
Caption: Figure 5.
Sequence of NVST Hα line center (panels (a)–(d)), fixed-base difference (panels (e)–(g)), and Hinode/SOT Ca II H (panels (i)–(l)) images capturing the genesis and propagation of a compact bright feature along the spine of the fishbone-like structure during a brightening process. The white arrows trace the motion of the compact bright feature, and the cyan arrows indicate mass flows toward the distant positive sunspot P. The iso-Gauss contours of ±50 G, superposed by red and blue curves in panel (d), are derived from the magnetogram acquired at 06:20:44 UT. A Hinode/XRT Be-thin image (panel (h)) shows the overall morphology of the brightening structure in the solar corona. Distance–time plots from NVST Hα line center images for the slit “AB” are shown in panel (m). The red dashed line in panel (m) outlines the motions of the compact brightening. An animation of panels (a)–(d) is available. The animation has a 16 s cadence, covering 05:34:20 UT to 06:55:52 UT on 2015 March 12.
(An animation of this figure is available in the online article.)
(An animation of this figure is available.)
The video/animation of this figure is available in the online journal.
Other Images in This Article
Copyright and Terms & Conditions
© 2026. The Author(s). Published by the American Astronomical Society.

