

Image Details
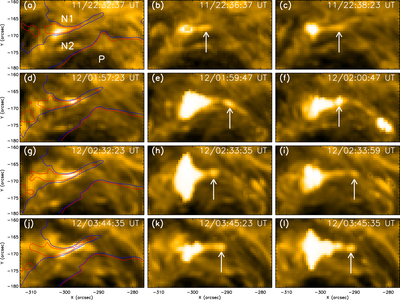
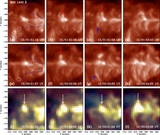
Caption: Figure 3.
(a)–(l) Sequence of AIA 171 Å images displaying the ejection of plasma blobs from the brightenings, which themselves originate from the fishbone-like structure and are ejected toward the distant positive sunspot P. Simultaneous HMI magnetograms are overplotted in panels (a), (d), (g), and (j) as red/blue contours for positive/negative polarity, with contour levels of 50 and –200 G, respectively. The white arrows point to the ejected plasma blobs. An animation of this figure is available. In the movie, events 1–4 correspond to panels ((a)–(c), (d)–(f), (g)–(i), and (j)–(l)), respectively. The animation has a 2 s cadence.
(An animation of this figure is available in the online article.)
(An animation of this figure is available.)
The video/animation of this figure is available in the online journal.
Other Images in This Article
Copyright and Terms & Conditions
© 2026. The Author(s). Published by the American Astronomical Society.

