

Image Details
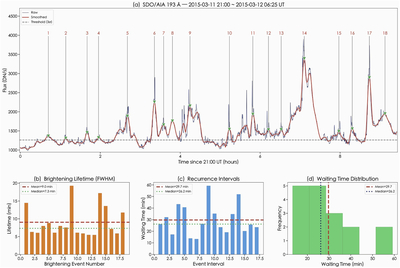
Caption: Figure 2.
SDO/AIA 193 Å light-curve analysis. (a) Raw (dark blue) and Savitzky–Golay smoothed (red) light curve from 21:00 UT on 2015 March 11 to 06:25 UT on 2015 March 12. The gray dashed line marks the 3σ detection threshold. Green inverted triangles indicate the 18 detected brightening events, labeled 1–18 with gray leader lines. (b) Lifetime (FWHM) of each brightening event (orange bars). The dashed and dotted horizontal lines denote the mean and median, respectively. (c) Waiting times between consecutive events. Dashed and dotted lines denote the mean and median, respectively. (d) Histogram of the waiting-time distribution with the mean (dashed) and median (dotted) overlaid.
Other Images in This Article
Copyright and Terms & Conditions
© 2026. The Author(s). Published by the American Astronomical Society.

