

Image Details
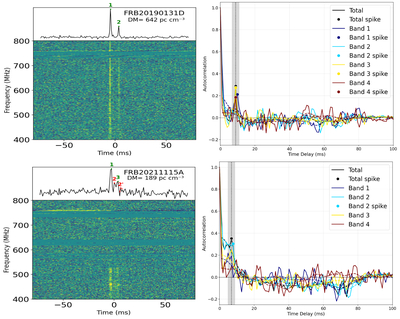
Caption: Figure 4.
Similar to the upper panel of Figure 3, but for FRB 20190131D and FRB 20211115A. In the lower-left dynamic spectrum for FRB 20211115A, peak 2 is shifted to the dashed peak based on the inferred flux ratio and time delay and is labeled as ﹩{2}^{{\prime} }﹩. The right panel shows the ACF with spikes within ±2 ms range for the total and four frequency bands independently, where a colored dot on a spike indicates that the ACF exceeds the 3σ smooth threshold.
Other Images in This Article
Copyright and Terms & Conditions
© 2026. The Author(s). Published by the American Astronomical Society.

Copyright ©
2026 Astronomy Image Explorer. All Rights Reserved.
