

Image Details
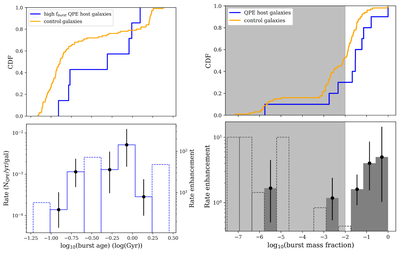
Caption: Figure 2.
Top left: a cumulative distribution function showing the burst ages of the QPE host galaxies that have had a significant burst of star formation and the entire control sample. Bottom left: the rate and rate enhancement of QPEs in galaxies that have experienced a significant burst of star formation as a function of burst age. Top right: a cumulative distribution function showing the burst mass fractions of the QPE hosts and the control sample. Bottom right: the rate enhancement of QPEs as a function of burst mass fraction of the host galaxy. The gray shaded region indicates parameter space where large uncertainties in the burst mass fraction (see the y-axis on the top panel of Figure 1) make interpretation difficult. In both bottom panels, the dotted histogram bars are bins that contain no QPE hosts but do contain control galaxies, and the height of the bin represents the upper limit on the rate/rate enhancement given the Poisson uncertainty on the number of QPE galaxies in that bin. There are no bars in bins where there are no QPEs and no control galaxies. The DTD shows a QPE rate/rate enhancement that increases with burst age, and the QPE rate enhancement vs. burst mass fraction graph shows an increase in the rate enhancement at high burst mass fractions.
Other Images in This Article
Copyright and Terms & Conditions
© 2026. The Author(s). Published by the American Astronomical Society.

