

Image Details
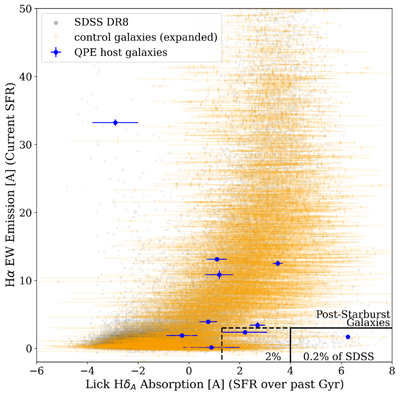
Caption: Figure 3.
The Hα emission equivalent width and Lick HδA absorption in the optical spectra of QPE host galaxies (blue points), galaxies from the expanded control sample (orange points), and SDSS DR8 (gray background). The box in the lower right corner bounded by solid black lines represents the region of parameter space where PSB galaxies reside, encompassing 0.2% of galaxies in SDSS DR8. Extending the box toward lower HδA values (dashed black lines) encompasses 2% of galaxies in SDSS DR8, representing QBS galaxies. PSB and QBS galaxies are overrepresented in our QPE host galaxy sample compared to both SDSS DR8 and the expanded control sample.
Other Images in This Article
Copyright and Terms & Conditions
© 2026. The Author(s). Published by the American Astronomical Society.

