

Image Details
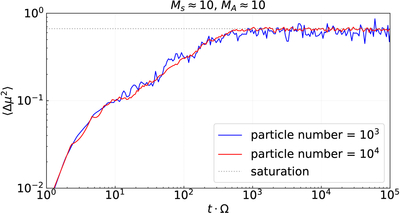
Caption: Figure A1.
Pitch-angle mean-square variations 〈(Δμ)2〉, as a function of the normalized time tΩ for the Ms ≃ 10 and MA ≃ 10 simulation. The initial pitch angle distribution is isotropic with rL/Lbox ≃ 8 × 10⁻³. The blue and red curves show results obtained using 103 and 104 particles, respectively. The gray dotted line marks the saturation value.
Other Images in This Article
Copyright and Terms & Conditions
© 2026. The Author(s). Published by the American Astronomical Society.

Copyright ©
2026 Astronomy Image Explorer. All Rights Reserved.
