

Image Details
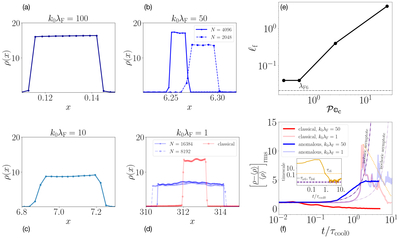
Caption: Figure 3.
The first two columns (panels (a)–(d)) represent four clouds of varying initial size ℓT, ∥0(k0λF) after saturation in the simulations with anomalous conductivity, radiative cooling, and maintained net thermal balance. The x-axis and y-axis are in code units (3.086 × 1021 cm and 1.672 × 10⁻²⁴ g cm−3, respectively). The second column (panels (b) and (d)) further demonstrates convergence of the cloud sizes. The upper panel in the third column (e) shows the final size (kpc) of the clouds as a function of initial ﹩{{ \mathcal P }{\mathbb{a}}}_{{\rm{c}}}={\lambda }_{{\rm{s}}}\ell /{\lambda }_{{\rm{F}}}^{2}﹩, and λF6 is the predicted Field length at low-temperature stable phase (2 × 10⁶ K) in our simulations. The lower panel (f) in the third column shows rms density fluctuations with time (normalized to mean τcool). In order to understand the decay of the classical large-scale cloud (light red), we further show the predicted classical decay timescale (τc6, orange), isobaric TI timescale (τib6, dark purple dashed), and isochoric TI timescale (τic6, light purple dashed) at 2 × 10⁶ K across all mean densities (at each time) in the inset. The orange line essentially tracks the decrease in the characteristic cloud size in the box.
Other Images in This Article
Copyright and Terms & Conditions
© 2026. The Author(s). Published by the American Astronomical Society.

