

Image Details
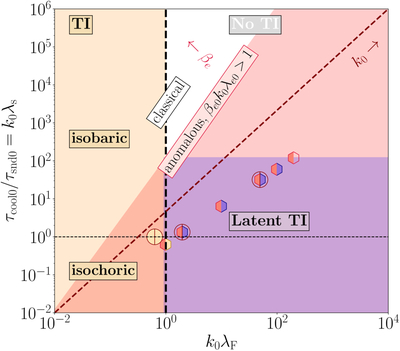
Caption: Figure 1.
A parametric space that defines the latent thermal instability (LaTI) zone in terms of the ratio of cooling time τcool0 to sound-crossing time τsnd0 on the y-axis and the normalized wavenumber corresponding to the initial temperature–gradient scale (k0 = 2π/ℓT,∥0) with respect to the classical Field length on the x-axis. The y-axis is also equivalent to the gradient scale with respect to the length λs that sound crosses in a cooling time. The yellow zone is the TI region for classical thermal conduction, the red zone (to the right of the line marked by βe0k0λe0 = 1) is the anomalous conduction region, and the purple zone, inside the anomalous conduction region, is the LaTI region, which opens up thermal instability at small scales (k0λF ≫ 1). We show the parameter space for βe0 = 5000 and indicate the expansion of the red region for higher βe0 with a red arrow. The hexagons show simulations including anomalous physics and the circles show simulations with only classical physics. The colors on the markers indicate the dominant physical processes—red/purple hexagons with anomalous conduction and LaTI; red/yellow hexagon with dominant TI entering the previously known regime; and half-red hexagon in the anomalous region but without LaTI.
Other Images in This Article
Copyright and Terms & Conditions
© 2026. The Author(s). Published by the American Astronomical Society.

