

Image Details
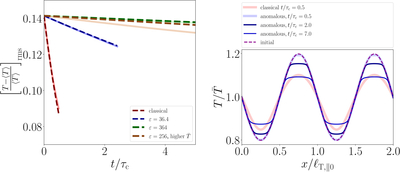
Caption: Figure 2.
Left: the decay of rms temperature fluctuation (with anomalous suppression and no radiative cooling) with time normalized by classical conduction rate. Solid lines represent simulations and dashed lines show exponential decay. Different colors demonstrate different ε = βe0λe0/ℓT,∥0. Right: comparison of the temperature profiles (normalized to initial mean temperature) for anomalous (blue) and classical (red) with ε = 36.4.
Other Images in This Article
Copyright and Terms & Conditions
© 2026. The Author(s). Published by the American Astronomical Society.

Copyright ©
2026 Astronomy Image Explorer. All Rights Reserved.
