

Image Details
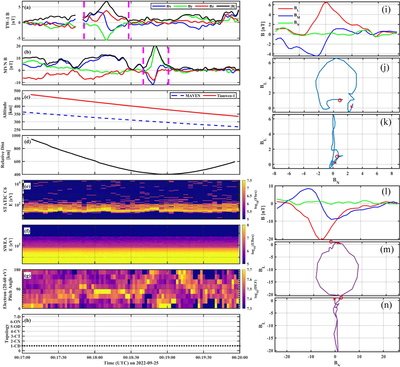
Caption: Figure 2.
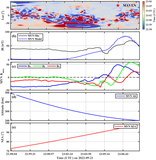
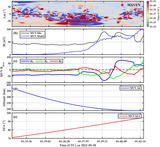
Time-series overview of the FR observed by TW-1 and MAVEN. Panels (a)–(b): magnetic-field components in MSO coordinates. (c) Spacecraft altitude. (d) Distance between MAVEN and TW-1. (e) STATIC ion energy spectrogram. SWEA electron measurements of (f) omnidirectional energy spectra and (g) pitch-angle distributions (PADs) of ionospheric photoelectrons with energies between 20 and 60 eV. (h) Magnetic topology score. (i) TW-1 magnetic field in the LMN coordinates. Panels (j)–(k): the hodograms of TW-1 magnetic-field components in maximum–intermediate (L–M), and maximum–minimum (L–N) planes. (l) MAVEN magnetic field in the LMN coordinates. Panels (m)–(n): the hodograms of MAVEN magnetic-field components in L–M and L–N planes.
Other Images in This Article
Copyright and Terms & Conditions
© 2026. The Author(s). Published by the American Astronomical Society.

