

Image Details
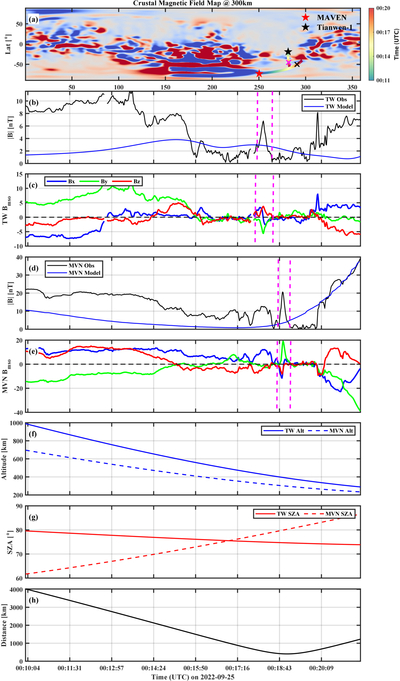
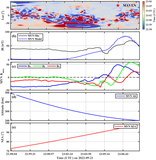
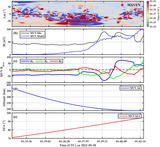
Caption: Figure 1.
An overview of magnetic-field measurements where MAVEN and TW-1 traversed during a time interval on 2022 September 25. (a) The spacecraft trajectory (rainbow line) projected onto the modeled crustal-field map at 300 km (J. Gao et al. 2021). Panels (b) and (d): the time profiles show the observed magnetic-field strength (∣B∣; black) together with the crustal-field model (blue; J. Gao et al. 2021). Panels (c) and (e): the observed magnetic-field components in MSO coordinates. (f) The spacecraft altitude. (g) The spacecraft solar zenith angle (SZA). (h) MAVEN and TW-1 distance. The ionospheric FR was observed between the magenta dashed vertical lines. The magnet and black crosses mark the FRs observed by TW-1 and MAVEN.
Other Images in This Article
Copyright and Terms & Conditions
© 2026. The Author(s). Published by the American Astronomical Society.

