

Image Details
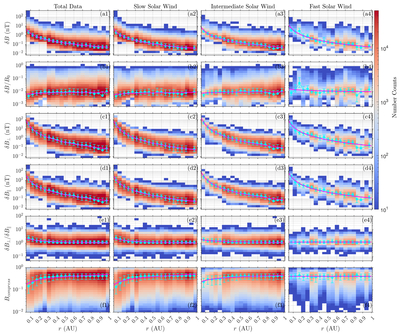
Caption: Figure 1.
The radial distributions of (a1)–(a4): the magnetic field fluctuation δB, (b1)–(b4): normalized magnetic field fluctuation δB/B0, (c1)–(c4): perpendicular magnetic field fluctuation δB⊥, (d1)–(d4): parallel magnetic field fluctuation δB∥, (e1)–(e4): ratio of magnetic field fluctuation in two directions δB⊥/δB∥, and (f1)–(f4): compressibility of magnetic field fluctuation Bcompress. From left to right, each column represents the statistical results of total data, slow solar wind data, medium solar wind data, and fast solar wind data, respectively. The filled points represent the median of each variable (the second quartile) in each radial bin, and the lower/upper error bar denotes the difference between the lower/upper quartile and the second quartile. The magenta lines are our power-law fitting results and the colors represent the number counts.
Other Images in This Article
Copyright and Terms & Conditions
© 2026. The Author(s). Published by the American Astronomical Society.

