

Image Details
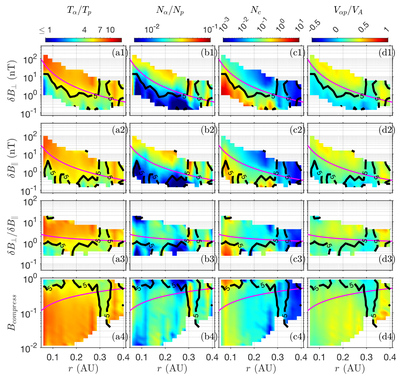
Caption: Figure 4.
The distribution of some plasma parameters (Tα/Tp, Nα/Np, Nc, and Vαp/VA) in several radial spaces. We only use PSP data in this figure. The magenta lines are power-law fitting results. The solid black lines are contour lines where Tα/Tp = 5.
Other Images in This Article
Copyright and Terms & Conditions
© 2026. The Author(s). Published by the American Astronomical Society.

Copyright ©
2026 Astronomy Image Explorer. All Rights Reserved.
