

Image Details
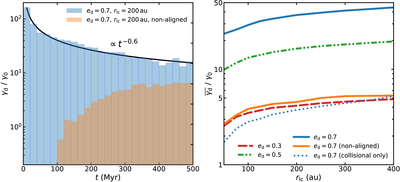
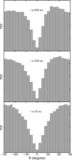
Caption: Figure 3.
Left: evolution of the close-encounter rate at r ≤ rlc = 200 au per disk star (γd), normalized to that for a relaxed population (γ0). The blue (orange) histogram shows the rate for an initially aligned (nonaligned) eccentric disk of ed = 0.7. Right: close-encounter rate per disk star averaged over 500 Myr (﹩\overline{{\gamma }_{{\rm{d}}}}﹩) for different ed and rlc, also normalized to γ0. For ed = 0.7, the rate for an initially nonaligned disk is shown as the orange line and that when the stellar orbital evolution is driven solely by two-body relaxation (collisional only) is shown as the dotted blue line.
Other Images in This Article
Copyright and Terms & Conditions
© 2026. The Author(s). Published by the American Astronomical Society.

