

Image Details
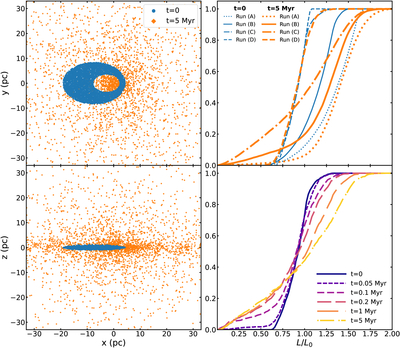
Caption: Figure 1.
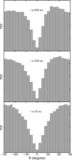
Left column: initial (blue) and final (orange) spatial distribution of the disk stars in Run (C) projected onto the x–y and x–z planes. Right column: cumulative distribution of the scalar angular momentum (L) of disk stars normalized to an arbitrary unit: L0 = 300 pc km s−1. The upper panel shows the initial (thin blue) and final (thick orange) distribution in different runs. The lower panel shows the distribution snapped at different times in Run (C).
Other Images in This Article
Copyright and Terms & Conditions
© 2026. The Author(s). Published by the American Astronomical Society.

Copyright ©
2026 Astronomy Image Explorer. All Rights Reserved.
